The Problem
The Splunk Universal Forwarder requires glibc. If your log source is running Alpine Linux, a minimal container, an embedded device, or an IoT gateway, you’re out of luck — those environments use musl libc, and the two are binary-incompatible.
In my home SOC lab I hit this exact wall. The perimeter firewall VM runs Alpine Linux (chosen for its small footprint and scriptability), and it’s running Suricata generating EVE JSON on the lab-facing interface. I needed that data in Splunk, and the UF wasn’t an option.
The approach: rsyslog’s imfile module tails any file and ships each line
over TCP; Splunk has a built-in TCP input that receives it.
One transform stanza strips the syslog header, and you’re left with clean JSON
in _raw.
Someone at Wild West Hackin’ Fest mentioned this exact problem, which prompted me to write it up.
How It Works
Suricata → eve.json → rsyslog imfile → TCP → Splunk TCP input → index=suricata
rsyslog’s imfile input module monitors a file and emits each new line as a
syslog message. The omfwd output module forwards those messages over TCP to
Splunk. On the Splunk side, a TCP data input receives the stream, and a
transforms.conf regex strips the syslog envelope (timestamp, hostname, tag),
leaving the original JSON payload as _raw.
The rsyslog Config
Create /etc/rsyslog.d/50-splunk.conf on your log source:
module(load="imfile" PollingInterval="5")

input(type="imfile"
      File="/var/log/suricata/eve.json"
      Tag="suricata-eve"
      Severity="info"
      Facility="local3"
      PersistStateInterval="10"
      ReadMode="0"
      FreshStartTail="on"
      StateFile="suricata-eve")

if $syslogfacility-text == 'local3' then {
    action(type="omfwd"
           Target="192.168.10.40"
           Port="5514"
           Protocol="tcp"
           Template="RSYSLOG_SyslogProtocol23Format")
    stop
}
Key options worth explaining:
FreshStartTail = on— rsyslog only ships lines written after it starts. Without this, every restart replays the whole file into Splunk.StateFile— rsyslog records its read position here. If you change the filename, rsyslog loses its position and replays from the start.PersistStateInterval = 10— flush the state file every 10 lines. Lower = more disk writes; higher = more potential replay on crash.- Port 5514 — I used 5514 to avoid colliding with my Wazuh syslog receiver on 514. Any unused TCP port works.
stop— prevents the message from also being written to the local syslog.
If you need to forward to a second destination simultaneously — say, both Wazuh
and Splunk — just add a second action() block before the stop:
if $syslogfacility-text == 'local3' then {
    action(type="omfwd" Target="192.168.10.10" Port="514" Protocol="tcp"
           Template="RSYSLOG_SyslogProtocol23Format")   # Wazuh
    action(type="omfwd" Target="192.168.10.40" Port="5514" Protocol="tcp"
           Template="RSYSLOG_SyslogProtocol23Format")   # Splunk
    stop
}
One config file, two SIEMs receiving the same data.
Splunk: TCP Input
In the Splunk web UI: Settings → Data Inputs → TCP → New Local TCP.
- Port: 5514
- Source type:
suricata:eve(create new) - Index:
suricata(create new)
Or add to inputs.conf on the Splunk server:
[tcp://5514]
connection_host = ip
sourcetype = suricata:eve
index = suricata
Splunk: Strip the Syslog Header
The data arriving at Splunk looks like this:
<190>1 2026-03-05T14:32:11.123456+00:00 fw-router suricata-eve - - - {"timestamp":"2026-03-05T14:32:11.123456+0000","flow_id":123456,"event_type":"dns",...}
To get clean field extraction, the syslog envelope needs to be stripped so
_raw contains just the JSON payload.
/opt/splunk/etc/apps/search/local/transforms.conf:
[strip_syslog_header]
REGEX = ^[^{]*(\{.+\})$
FORMAT = $1
DEST_KEY = _raw
The regex ^[^{]*(\{.+\})$ skips everything before the first { and captures
the rest. It’s greedy on the trailing }, which is fine — EVE JSON is always a
single flat object per line.
/opt/splunk/etc/apps/search/local/props.conf:
[suricata:eve]
SHOULD_LINEMERGE = false
KV_MODE = json
TIME_PREFIX = "timestamp":"
TIME_FORMAT = %Y-%m-%dT%H:%M:%S.%6N%z
TRANSFORMS-strip_syslog_header = strip_syslog_header
KV_MODE = json handles all field extraction automatically. After the
_raw transform strips the header, Splunk sees clean JSON and extracts every
field — event_type, src_ip, dest_ip, alert.signature, dns.rrname,
and so on — without any field aliases.
Restart Splunk after editing these files:
sudo -u splunk /opt/splunk/bin/splunk restart
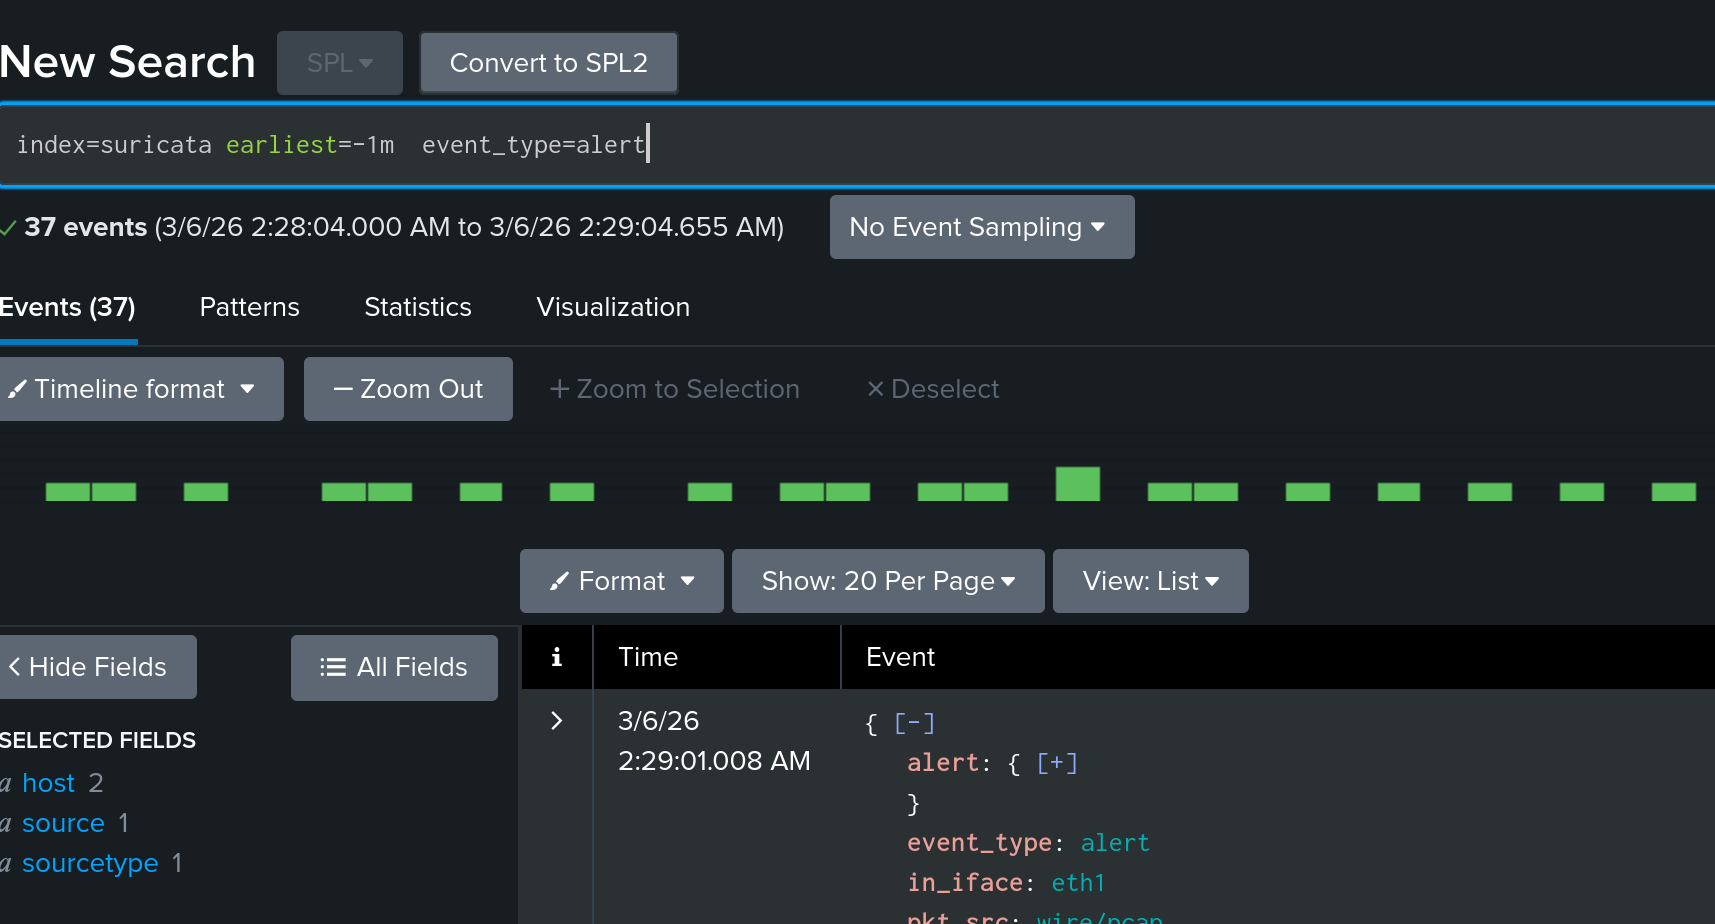
Verification
Once logs are flowing, confirm the data looks right:
| Confirm events are landing and field extraction is working
index=suricata | stats count by event_type

| Recent alerts
index=suricata event_type=alert
| table _time, src_ip, dest_ip, dest_port, alert.signature, alert.severity

| DNS queries seen by Suricata
index=suricata event_type=dns dns.type=query
| table _time, src_ip, dns.rrname

| TLS connections with SNI
index=suricata event_type=tls
| table _time, src_ip, dest_ip, tls.sni, tls.version
If event_type is populated and the timestamp on _time matches the event
rather than ingestion time, the transform and time parsing are both working.
When the UF Isn’t an Option
The imfile approach works wherever rsyslog runs — Alpine, BusyBox-based
containers, Raspberry Pi images, IoT gateways, network appliances with a syslog
daemon baked in. For this use case — tailing one file and forwarding over TCP — it gets the job done.
The trade-off is that you lose UF-specific features like acknowledgement-based
delivery and the Splunk-to-Splunk protocol compression. For a lab or a
low-volume single-file source, TCP with PersistStateInterval is reliable
enough.
Written with AI assistance (Claude).